Introducing Customer Value Score: A New Approach to a CX Staple
Customer Lifetime Value requires years of data to provide value. Our new metric, Customer Value Score, is a proactive approach that provides insights sooner.
Customer Lifetime Value, or CLV, has long been a metric mainstay for customer experience (CX) organizations to determine their customer base values and prioritize marketing spend. While it has notable predictive abilities, CLV’s power is dependent on the availability of robust customer purchase and interaction data to provide meaningful insights. For mature organizations, this data is often readily available and so defining CLV is a routine exercise. For organizations with limited or disparate data, building out a CLV model is possible but likely will take time for the output to become significant.
Luckily, there is another way to approach CLV that answers for those with data hurdles and gives them insights to make decisions proactively that also positively influences CLV over time: Customer Value Score.
What is Customer Value Score?
Customer Value Score, or CVS, is a method for understanding variable and fixed costs and attributing them to customer segments, allowing savvy customer experience practitioners to derive their largest cost drivers as well as their most or least profitable customer segments. Although long-tenured datasets will provide the most accurate information, CVS can begin to provide actionable information with only a fiscal year’s worth of data and continues to improve as more datapoints become available.
A 3-Step Approach to Customer Value Score
Not only does CVS help organizations action on their data earlier than CLV, it also is driven by a straightforward, 3-step approach that can easily be revisited as cost drivers and customer segments change.
1. Identify Cost Drivers
Defining your organization’s CVS begins with identifying your variable and fixed costs. Consider leveraging your customer journey map to determine the teams and processes involved. These will provide a well-founded starting point for pinpointing the cost drivers involved. For sensitive data such as employee cost rates, you may wish to use an average or range versus actual data to abide by confidentiality policies. During this stage, a list of customer segments should also be pulled.
Once you have a comprehensive list of cost drivers and a list of customer segments, you’re ready to define your customer segment share percentage and cost driver share percentage. These inform two other metrics that are ultimately responsible for building your scoring scale for CVS:
To get your customer segment share percentage, compare each cost driver against the total of all cost drivers for a particular customer segment. This will then allow you to calculate your cost per customer segment.
To get your cost share percentage, compare each cost against the total of this cost for all customer segments. This will then allow you to calculate each cost driver’s percentage of total revenue.
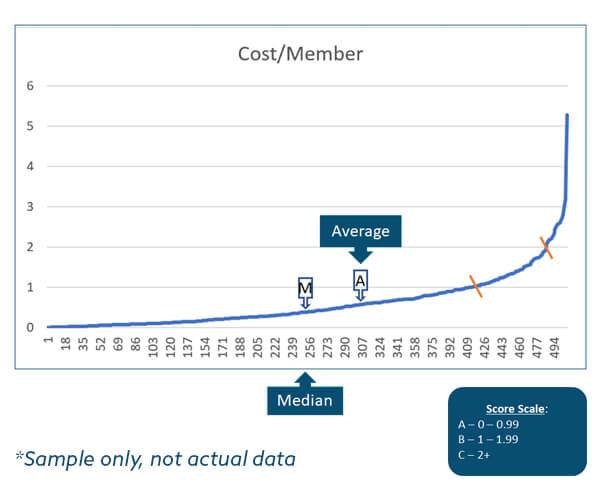
Example of cut points derived from cost per customer segment data.
After these metrics are understood, cut points can be calibrated. Cut points are determined by the spread of values across the population and should be re-calibrated when new cost drivers are added or anything else changes that is part of the scoring algorithm.
A scoring scale, generally consisting of three levels – majority, increased, and elevated – is informed by the median and averages of these metrics plotted on a line graph. Just as the levels allude to, the majority should fall into the majority score, a smaller percent should fall into the increased score, and the smallest percent should fall into the elevated score. The exact cut points for these scores will be unique to your organization and what constitutes statistical significance in your data.
3. Take Action
Once armed with the scoring scale, cost drivers and customer segments can be loaded into interactive dashboards customized to the stakeholders they serve. Whether you’re looking to determine which costs to address, or which customer segments offer the best return on investment, you and your teams will be empowered to make data-backed decisions. Consider adding individual year and year-over-year views as more data becomes available to further enhance analysis.
Looking Ahead
By mastering your Customer Value Score, you can begin to understand customer needs and behaviors based on how they interact with your organization. It will also illuminate which services they require to make purchasing and retention decisions. Ultimately, this information will enable you to optimize your CX and marketing efforts to target and retain loyal customers, and thereby improve your CLV along the way.
Whether you’re just getting started or are looking to understand the data in front of you, we’re here to help; check out our Customer Experience offerings to learn more.
Evan Struke is a CX subject matter expert and serves as our CX Services Project Manager. She is passionate about helping clients drive meaningful value by keeping the customer at the heart of digital delivery and transformation.
RevGeneration closes the revenue intelligence gap by finding exactly where your revenue opportunities hide and implementing solutions that deliver real results.