Imagine a Customer Lifetime Value (CLV) calculation that can keep up with a rapidly changing economy. Individuals are adjusting their purchase habits: shifting from in-store to online; restaurant tabs to grocery receipts; and re-booking trips for the fall.
We need a way to measure the value of a customer that considers nuances around purchasing behavior while also considering industry or global purchasing trends. We need to be able to identify if the change in purchasing habits has increased sales, decreased sales, or just changed the purchase window with delayed consumption or bulk purchases. We need a calculation that goes beyond retention scores and average order value and incorporates the ‘frequency‘ and ‘recency‘ of purchase behaviors to determine if a customer is going to come back or if they’re gone for good.
Customer Lifetime Value Approach
Customer Lifetime Value is a metric to measure the health of your customer and product or service base. More importantly, CLV should be driving daily decisions about your investments – both time and money! CLV is defined as the predicted value of revenue tied to the future relationship with a customer.
An agile way to calculate the lifetime value of a customer is by using probabilistic models to assess (1) the expected number of future transactions the customer will make and (2) the probability they are retained.
We look at historical sales or transaction data – specifically the tenure of the customer, how frequently they’ve purchased, and how recently they’ve purchased – to fit two probability distribution curves per customer. We can calculate:
The expected number of transactions the customer will make in future period of length T which follows a Poisson distribution
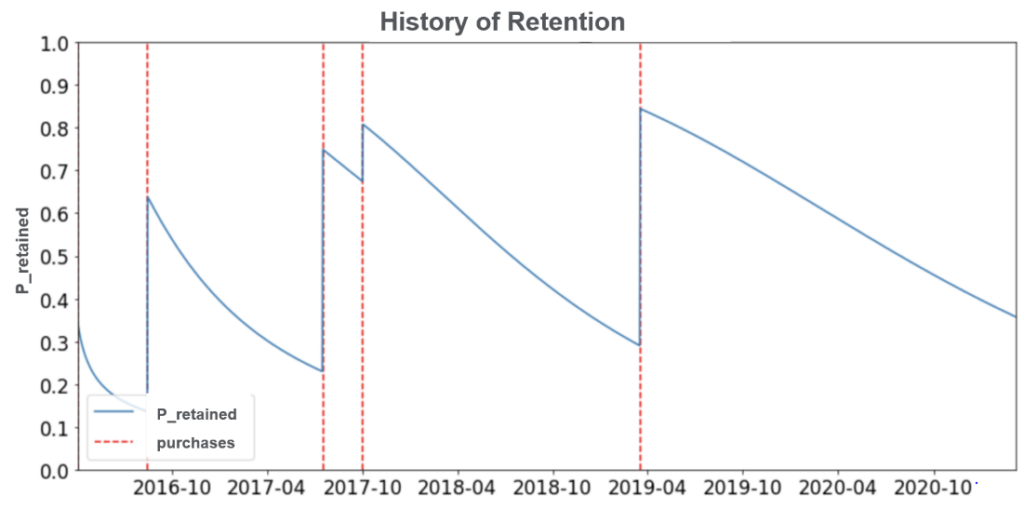
The probability they are still retained in the given period which follows a shifted Geometric distribution
These curves are then combined and used to predict lifetime value:
CLV = Expected number of transactions * probability they are still retained * average transaction value
Using the example graph below – we see that both the recency of a purchase and the frequency of purchases increase the probability of a customer being retained in the following period.
New customer habits and behaviors are forming – forcing organizations to respond. This agile approach to CLV only requires three data fields per customer and has proven success in determining if a customer is going to come back or they’re gone for good. Customers are innovating the way they purchase; so let’s meet them where they are and innovate the way we measure, predict, and respond to their behavior.
Meghan Villard is a manager with RevGen Partners. She is passionate about empowering clients to make data-driven decisions that deliver value to their business.
RevGeneration closes the revenue intelligence gap by finding exactly where your revenue opportunities hide and implementing solutions that deliver real results.