It’s Official: RevGen is a Great Place to Work
News & Events
For our second year, RevGen has been certified as a "Great Place to Work"
Read More About It’s Official: RevGen is a Great Place to Work
Because we know behavioral coaching influences key KPIs, we can use coaching data to create custom programs to identify effective coaching methods and trends across teams.

Previously, we talked about behavioral coaching and how it fosters an environment that empowers call center agents to provide even better experiences for customers. Today, we are going to get our hands dirty with data and start finding answers to complicated questions like “who is an effective coach?” or “who are good coachees?” and “do good coachees even need a good coach?”.
To answer these, we are going to build out a Python script using some commonly available libraries. First, however, we’ll be generating some simulated data to analyze.
There are plenty of advantages to using simulated data. It allows us to test different scenarios by picking exactly the data we want to use and put it in a shape that aligns with our Python scripts. Another benefit is that we can demonstrate the system is effectively identifying trends by manipulating a coach/coachee dataset around a particular behavior.
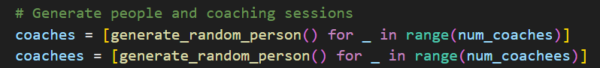
So, how should we generate coaching data to learn and test our analysis? Let’s start with 10 coaches and let’s say each has 10 people on their team that they coach, giving us 100 coachees. We’ll use the Faker library to generate some random names for our coaches and coachees.
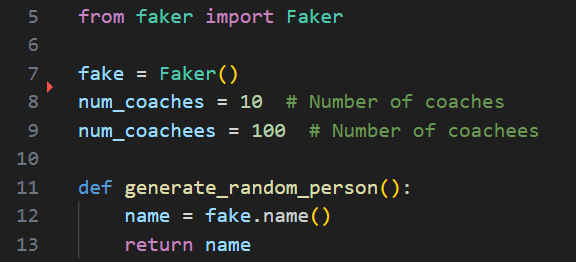
Now, let’s use that code to generate some people.
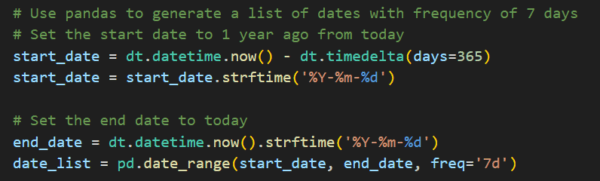
Now, let’s pick a timeline for the coaching sessions we are going to create. Here we pick the past year.
For this example, we’re using RevGen’s values of “Respect”, “Integrity”, “Stewardship”, and “Enjoyment” as the behaviors we are collecting coaching data on. Spoiler: In the next code snippet, we will purposefully skew the data to ensure that our analysis finds a trend.
How frequently can we coach?
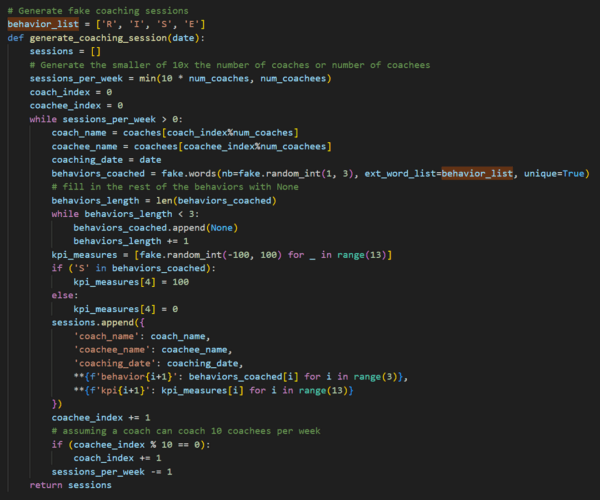
At the top, we initialize a limitation on how often coaching can reasonably happen per week. This is set to 10 sessions per week (2 sessions a day, five days a week). Then we use a counter and modulus math to continuously loop over our coaches and coachees to create our coaching sessions.
Each coaching session record will end up looking like this:
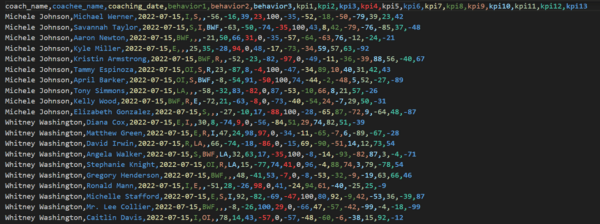
(Shoutout to Rainbow CSV for such a useful and beautiful extension in VS Code!)
Our basic information is the identity of the coach, the identity of the coachee, coaching date, up to 3 behaviors coached within the session, and 13 KPI measurements from -100 to 100 to represent percent change since previous measurement. To close out this data generation script, here’s the “meat and potatoes” of the code to print the data to a CSV to be analyzed.
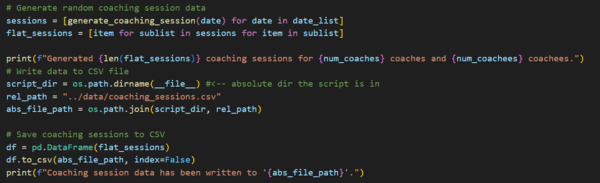
Typically, we would ensure KPI measurements are in a different table, as they are generally recorded at a different frequency than the coaching sessions, but for this example we are simplifying the output.
Now that we have our coaching sessions and KPI changes, let’s look into how we would find trends between these behaviors and their effect on KPIs.
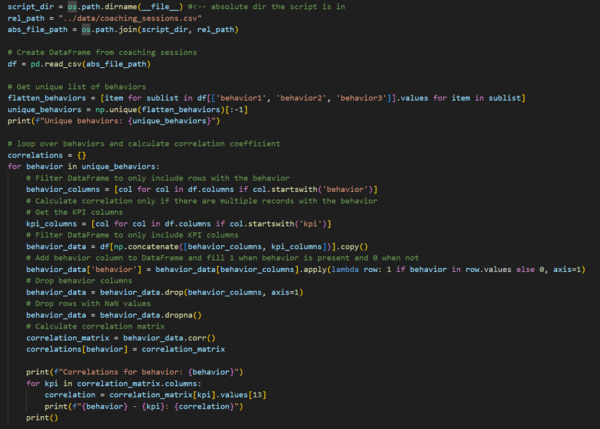
Looking at the code above, we first get a distinct list of behaviors from our CSV. Since our behavior has generated as a “string” of non-numerical values, we need to turn it into a number so that we can run a Pearson correlation coefficient analysis on the Panda DataFrame. The KPIs are already numbers, and we are going to assume that the KPI percent change is over the 2 weeks following the coaching session.
In future articles, we can discuss in further detail how to provide granular KPI measures and experiment with varying timespans following the coaching session. This is all the code other than the imports for things like NumPy, Pandas, OS, etc.
So, what are the results?
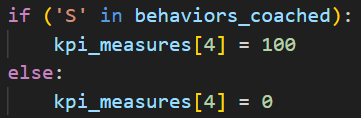
Remember the spoiler above in generating our coaching sessions? If someone coaches “S” for “Stewardship”, we can override kpi[4] to be 100(%) and when it’s not coached, set it to 0. This way, we’ve artificially created a trend between coaching on stewardship and kpi[4]. Here are the results!
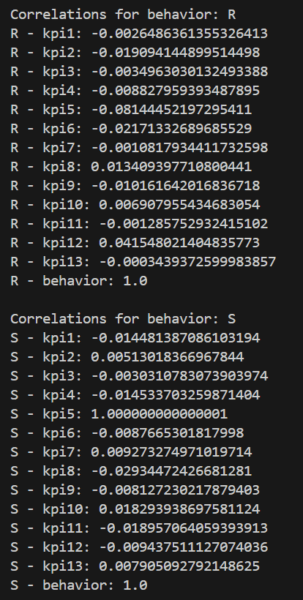
At first, it looks like the random number generator is doing a decent job being random. We can see that most trends are close to 0, but for “S” we see a positive trend with kpi[4] (zero-indexed arrays means kpi[4] is printed as kpi5). We can also pipe this data into another Python library to create better visualizations than just a text print-out.
Now that we’ve demonstrated how we can easily find trends between coaching behaviors and KPIs, we can identify which behaviors to coach on to improve specific KPIs. We could also take this further to find which coaches have a higher KPI percent change, as a measure of effectiveness. This enables us to make better decisions about:
We hope this demonstrated how easy it is to create and analyze call center coaching data in Python with commonly available tools. These tools and data analysis techniques can be applied to all sorts of use cases across almost every industry.
If you are excited about finding trends in your own data, contact us to schedule a chat with one of our experts or head to our Digital Enablement page to learn more about our other services.
 Kevin Able is a Principal Architect in RevGen’s Digital Enablement practice. He is passionate about delivering practical solutions that drive value to his clients.

For our second year, RevGen has been certified as a "Great Place to Work"
Read More About It’s Official: RevGen is a Great Place to Work
In our expanding digital landscape, viewing enterprise architecture from a time-based lens can better balance strategic vision and tactical expertise
Read More About Applying Enterprise Architecture Across the Lifecycle
AI-powered quality control is transforming manufacturing through smarter defect detection, real-time data analysis, and enhanced productivity
Read More About AI-Powered Quality Control in Manufacturing: A Game ChangerGet the latest updates and Insights from RevGen delivered straight to your inbox.